2017 November Housing Data Snapshot
WASHINGTON (December 20, 2017) —
2017 November Housing Data Snapshot-
Existing-home sales surged for the third straight month in November and reached their strongest pace in almost 11 years, according to the National Association of Realtors®. All major regions except for the West saw a significant hike in sales activity last month.
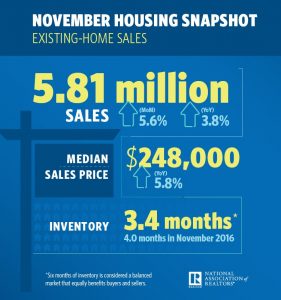
Total existing-home sales1, https://www.nar.realtor/existing-home-sales, which are completed transactions that include single-family homes, townhomes, condominiums and co-ops, jumped 5.6 percent2 to a seasonally adjusted annual rate of 5.81 million in November from an upwardly revised 5.50 million in October. After last month’s increase, sales are 3.8 percent higher than a year ago and are at their strongest pace since December 2006 (6.42 million).
Lawrence Yun, NAR chief economist, says home sales in most of the country expanded at a tremendous clip in November. “Faster economic growth in recent quarters, the booming stock market and continuous job gains are fueling substantial demand for buying a home as 2017 comes to an end,” he said. “As evidenced by a subdued level of first-time buyers and increased share of cash buyers, move-up buyers with considerable down payments and those with cash made up a bulk of the sales activity last month. The odds of closing on a home are much better at the upper end of the market, where inventory conditions continue to be markedly better.”
The median existing-home price3 for all housing types in November was $248,000, up 5.8 percent from November 2016 ($234,400). November’s price increase marks the 69th straight month of year-over-year gains.
Total housing inventory4 at the end of November dropped 7.2 percent to 1.67 million existing homes available for sale, and is now 9.7 percent lower than a year ago (1.85 million) and has fallen year-over-year for 30 consecutive months. Unsold inventory is at a 3.4-month supply at the current sales pace, which is down from 4.0 months a year ago.
2017 November Housing Data Snapshot Infographic
